
June 2026
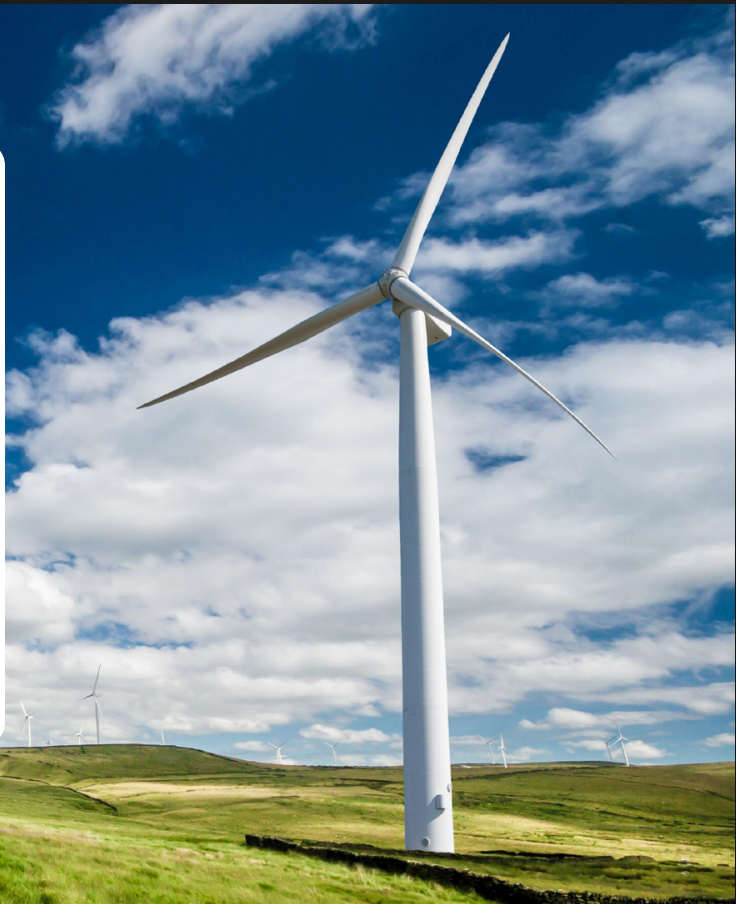
Powering Opportunity Across the UK: A LinkedIn UK Green Skills Report
UK workers with green skills are getting hired faster. See what’s driving demand, and which skills are spreading in the report.
Learn more →Linkedin Economic Graph
A real-time view of how the global workforce is hiring, learning, and shifting — built from over 1.3 billion LinkedIn members.
Overview
We partner with world leaders to analyze labor markets and recommend policy solutions to prepare the global workforce for the jobs of the future. Through these insights, we can help connect more people to opportunities — one member at a time.
Interactive data & insights
June 2026
UK workers with green skills are getting hired faster. See what’s driving demand, and which skills are spreading in the report.
Learn more →
December 2025
This report explores growth engines for small businesses navigating future work.
Learn more →
Updated April 2026
Real-time trends showing how professionals and companies are adapting to AI.
Learn more →
October 2025
Reports and resources about using skills-based hiring to build a more resilient workforce.
Learn more →
Updated March 2026
Trends at the intersection of workforce and sustainability.
Learn more →
March 2026
LinkedIn data on what percentage of leaders are women — and the gender disparities along the path to leadership.
Learn more →Methodology: “Hiring Rate” is the count of hires (LinkedIn members in each industry who added a new employer to their profile in the same month the new job began), divided by the total number of LinkedIn members in the relevant region. By only analyzing the timeliest data, we can make accurate month-to-month comparisons and account for any potential lags in members updating their profiles. This number is indexed to the average month in 2016 for each industry; for example, an index of 1.05 indicates a hiring rate that is 5% higher than the average month in 2016.
Explore how hiring momentum compares across India, the United Kingdom, and the United States — indexed to a common baseline so the trends line up.
Hover over any month to read the exact values, then dive into the latest report for the long-form analysis.
Explore all reports →Here are our partners helping us map the global economy.
Eurostat
Statistical office of the European Union.
IDB
Development bank for Latin America and the Caribbean.
ILO
UN agency for global labor standards and decent work.
NASWA
National association of state workforce agencies.
NGA
Bipartisan organization of U.S. state & territory governors.
NLC
Voice for America's cities, towns, and villages.
OECD
Economic policy forum across 38 member countries.
World Bank
Global institution for ending poverty and boosting prosperity.
WEF
International forum for public-private cooperation.
Discover our latest content and never miss a report.
*Hiring data is updated monthly to reflect data from the prior month.