
LinkedIn Economic Outlook
State of the Labor Market | October 2022

Head of Economics and Global Labor Markets at LinkedIn
This monthly series includes the commentary on trends we see in LinkedIn’s Economic Graph data, detailing global trends in labor market demand and supply, hiring, separations, turnover and the overall economic climate. Additional information about the Economic Graph can be found at economicgraph.linkedin.com.
The three main takeaways are:
Job markets around the world show signs of cooling down amid higher rates and slower economic growth. Hiring is down in every country we track and more people are jumping back into the labor pool.
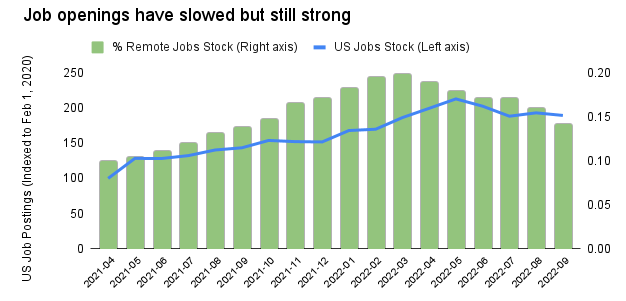
In the U.S., the labor market remains a bright spot in an otherwise gloomy environment. Job postings have been edging lower especially in sectors where remote work is more frequently advertised. However, openings are still at a historically high level compared to their pre-pandemic baseline.
We’re still in a job seeker’s market–there is one job vacancy for every active job seeker on LinkedIn. Workers are still quitting their jobs at rates above those seen before the pandemic, with many leaving their positions after being held for less than a year.
Global economic activity is experiencing a broad-based slowdown, with increased risks of a recession in the US, the UK, and the Euro area. A key factor slowing global growth is the ongoing tightening of monetary policy in most major economies in response to soaring inflation. The US economy could tip into a short but mild recession in 2023 as the Federal Reserve raises rates to tame prices and the recession in the Euro area likely will reflect surging energy prices and rationing. Asian cyclical risks look far better, with no signs of a recession in the near term.
Labor markets are cooling down across the globe, but job openings on LinkedIn remain well above their pre-pandemic baseline. The ratio of job openings to active applicants, LinkedIn’s measure of the tightness of the labor market, remains historically high in many countries. Nonetheless, the pace of job growth in North America and Europe has slowed, vacancies have begun to decline in some countries, and the reduction in the unemployment rate appears to have bottomed out or even reversed in some countries.
Hiring has started to slow down globally when compared to one year ago. The largest year-on-year declines in LinkedIn’s Hiring Rate are reported in India (-18.3%), Mexico (-15%), and Brazil (-14.7%). Professional Services contributed to this slowdown, with India (-29%), Mexico (-27%), Brazil (-27%), and Australia (-24%) most affected. Another industry affected was Technology, Information and Media, with Australia (-29%), Brazil (-27%), India (-21%), the United Kingdom (-16%), and the United States (-15%) all showing significant decreases.

Source: LinkedIn

Source: LinkedIn
The State of the Labor Market in the U.S.
The state of the labor market, through our own lens at LinkedIn, can be understood by looking at the set of indicators shown in the table below. The overall picture is that the labor market is slowly beginning to cool off as the Federal Reserve barrels ahead with its efforts to slow the economy and fight inflation.
| January 2020 | September 2022 | |
| Hiring rate | 1.15 | 1.09 |
| Job openings to active applicants ratio | 0.54 | 1.02 |
| Applications per applicant | 4.75 | 8.96 |
| Separation rate | 1.15 | 1.63 |
Linkedin Hiring Rate and LinkedIn Separation Rate are indexed to the average month in 2016. For example, an index of 1.05 indicates a hiring rate that is 5% higher than the average month in 2016.
Source: LinkedIn.
The fall in job openings did not happen evenly across industries
Job growth eased slightly in September but remained robust, indicating that the economy was maintaining momentum despite higher interest rates. The plunge in job openings is a result of overall tightening and employers reducing their future hiring plans. Jobs that saw the biggest declines in postings include those in Technology, Real Estate, and Professional Services. The downward trend is likely to continue among these industries and in others that are sensitive to rising inflation, falling stock prices and contractions in other parts of the economy.
Remote job postings have dipped for the fifth straight month, but continue to attract a majority of applications. About 1 in 6 of U.S. paid job postings offered remote work in September 2022, decreasing steadily from a high of 19.8% in March 2022 but still up from 13.2% in August 2021. This share of applications has increased dramatically since the data was tracked starting January 2020 when 2.2% of remote jobs attracted 2.9% of applications.
Source: LinkedIn

Source: LinkedIn
It’s still a job seekers labor market
The labor market has started to cool down, but conditions are still relatively tight when compared to the pre-pandemic baseline. In the figure below, we plot LinkedIn’s measure of labor market tightness–the ratio of job openings to total active job seekers. This metric differs from the conventional measure of labor market tightness, the V/U ratio, which looks at job openings (V) relative to the number of unemployed workers (U). Our measure captures all available job seekers who are actively applying for jobs (unemployed and employed). According to our measure, job openings relative to active applicants is close to parity. This ratio is considerably lower than the conventional V/U measure, although it is still elevated compared with its historical average.
Additionally, labor supply has not grown as swiftly as demand, but people are returning to the labor market. Job seekers on LinkedIn have increased the intensity of their job search in September– the average number of applications per applicant have increased by 18% year-on-year. Conditions, however, are showing some signs of normalizing, with wider economic weakness starting mid-2022 potentially feeding into softening labor demand.
Along with the fall in job openings, LinkedIn’s hiring rate fell in September by 8.9% compared to August and 12.7% compared to September 2021. The decline reverses the temporary hiring spike which occurred in August, bringing the hiring rate closer to where it was in July. Hiring fell across all industries, but one sector that is still unambiguously contracting is Technology. Hiring in that industry has fallen for 6 months in a row. It’s down 14.7% y/y, and 18.0% since April. Across the 20 cities we track regularly, all have seen hiring decline since April. The ones holding up the best are Miami and Houston. The ones declining sharply over this period are Chicago, Detroit and Cleveland.

Source: LinkedIn

Source: LinkedIn
Workers are still quitting their jobs at a record rate
Quitting continued to increase for the fourth month in a row, reinforcing the tightness of the labor market. LinkedIn Separation Rate, which measures the rate at which LinkedIn members end their positions, 13.2% Y/Y in September. Notably, total separations, which include both voluntary and involuntary separations, were highest in Hospitals and Health Care, Technology, Information and Media. More workers have been quitting their jobs within a year. The share of positions lasting less than a year nearly reached +10% Y/Y in March 2022, but this growth has slowed in past months to +3.9% Y/Y in September 2022.

Source: LinkedIn

Source: LinkedIn
Job switching is starting to level off
Employed workers are also finding new work although at a lower rate than the previous year. Growth in US job transitions rate slowed back down to -5.4% Y/Y in September 2022 compared to high rates of +50.9% Y/Y last August 2021. Gen Z, the fastest growing and most diverse segment of the U.S. labor market, continues to lead the way on job changing and moves. However, the rate of job transitions among this cohort is coming back closer to the other generations.
Job seekers voice growing doubts about their companies’ performance
Job seekers’ optimism about their employers’ business outlook dropped significantly in the recent weeks, according to data from the most recent edition of LinkedIn’s Workforce Confidence Survey. Specifically, the survey, conducted between September 10 and September 23, found that 47% of U.S. active job seekers voiced growing concerns about their employers’ performance. A slowing economy, along with persistently high inflation rate, is the most obvious reason behind this decline in confidence. As the graph below shows, that’s the highest level of unease since the survey was introduced in early 2021. Intriguingly, it’s the workforce’s oldest generation, baby boomers (born between 1946 and 1964) that are viewing the current environment most serenely. Only 34% of boomer job seekers report eroding confidence in their employers, according to the Workforce Confidence survey.

Source: LinkedIn

Source: LinkedIn
The outlook for the U.S. labor market going forward
The labor market remains strong, as can be seen across a variety of measures, from the low unemployment rate to the high quits rate, which illustrates the confidence of workers who are willing to leave their jobs in pursuit of better ones. Labor force participation, as measured by the BLS, remains lower than it was prior to the pandemic, reflecting several factors, including people who left the workforce for early retirement and some remaining parents who stayed home through the pandemic. These are not factors that reverse on a dime.
With still-strong labor demand and sluggish labor supply, the job market remains hot. Workers are moving between jobs more rapidly than in the past, putting upward pressure on wages. In a market with more job openings than workers, the competition to fill vacancies is leading to rapid wage gains now, and the result is that inflation will remain elevated. As growth has slowed this year, supply-demand conditions in the labor market–and the overall economy–seem likely to ease some.
The U.S. labor has been offering plenty of opportunities for workers while presenting some challenges to employers. However, the current situation will undoubtedly change. We will continue to monitor these trends and track others as conditions in the labor market evolve.
Spotlight: Technology Sector
| Tech Hiring | Hiring in the sector is down 14.7% Y/Y in September 2022. This comes against the backdrop of Summer 2021 having been an elevated time for hiring in this sector. |
| Tech Migration | Tech cities surge in migration after declines throughout the pandemic.
|
| Tech Jobs | Technology, Information, and Media was the industry with the greatest percentage of paid remote job postings in July 2022 (42.1%) and have been the top industry since August 2020, followed by Professional Services (29.7%), Education (25.4%), and Administrative and Support Services (25.4%). |
+++++++++++++++++++++++++++++++++++++++++++++++++++++++++++++++++
Technical Note and Definitions
Hiring Rate. The LinkedIn Hiring Rate (LHR) is the number of LinkedIn members who added a new employer to their profile in the same month the new job began, divided by the total number of LinkedIn members in that country. By only analyzing the timeliest data, we can make month-to-month comparisons and account for any potential lags in members updating their profiles. This number is indexed to the average month in 2016; for example, an index of 1.05 indicates a hiring rate that is 5% higher than the average month in 2016.
Open Job Postings. Open premium job postings (paid job postings by employers) on LinkedIn are counted each day. A 14-day moving average of open job postings is calculated to reduce noise from the daily data. The 14-day moving averages of open job postings are then indexed to February 12th of that year.
Remote Jobs. A “remote job” is defined as one where either the job poster explicitly labeled it as “remote” or if the job contained keywords like “work from home” in the listing. The share of remote jobs is calculated in proportion to all paid job postings. LinkedIn analyzed over 1.5 million paid remote job postings in the United States posted since January 2020.
Separation Rate. LinkedIn’s separation rate (LSR) measures the rate at which employees are leaving their positions. These include both voluntary and involuntary separations.
Short tenure rate. The YoY change of the “short tenure rate,” is defined as the fraction of positions that were held for less than a year.
Job Transitions. Job transitions are calculated from updates to LinkedIn profiles when a new job at a different company is created after a previous job has ended. This is divided by LinkedIn membership to account for membership growth. This share is compared to the equivalent time in 2019, before COVID, to benchmark the job transition rate against a more “typical” economic year. Student jobs, side jobs, and internships are not included. Jobs must be created on LinkedIn in the same month of the job start date to account for lag in how members update their profile.
Labor Market Tightness. Tightness is measured as the ratio of active vacancy postings in a given month divided by the total number of applicants applying to job postings in the same month. We include all individuals applying from within the U.S., and who submit at least one application to a U.S.-based job posting.
Workforce Confidence Index. LinkedIn’s Workforce Confidence Index is based on a quantitative online survey of LinkedIn’s Market Research team that is distributed to members via email every day and aggregated every two weeks. Roughly 5,000 U.S.-based members respond to each two-week wave of the survey. Members are randomly sampled and must be opted-in to research to participate. The results represent the world as seen through the lens of LinkedIn’s membership; variances between LinkedIn’s membership and the overall market population are not accounted for.
Reliability of the estimates. LinkedIn data should not be treated as a random sample of a country’s workforce. In general, although LinkedIn data are not representative of the entire economy and are self-reported, they can uniquely capture segments of the economy that are among the most innovative and dynamic. In addition, because these data are updated more frequently than traditional government statistics, they have the unique ability to capture the latest employment and industry skills needs, which government statistics often miss –especially in the digital and disruptive technology sectors.