
LinkedIn Workforce Report | United States | April 2021
Over 176 million workers in the U.S. have LinkedIn profiles; over 97,000 companies in the U.S. use LinkedIn to recruit, and members can add over 38,000 skills to their profiles to showcase their professional brands. That gives us unique and valuable insight into U.S. workforce trends.
This LinkedIn Workforce Report is a monthly report on employment trends in the U.S. workforce. It’s divided into two sections: a National section that provides insights into hiring and migration trends across the country, and a City section that provides insights into localized employment trends in 20 of the largest U.S. metro areas: Atlanta, Austin, Boston, Chicago, Cleveland-Akron, Dallas-Ft. Worth, Denver, Detroit, Houston, Los Angeles, Miami-Ft. Lauderdale, Minneapolis-St. Paul, Nashville, New York City, Philadelphia, Phoenix, San Francisco Bay Area, Seattle, St. Louis, and Washington, D.C.
Key Insights
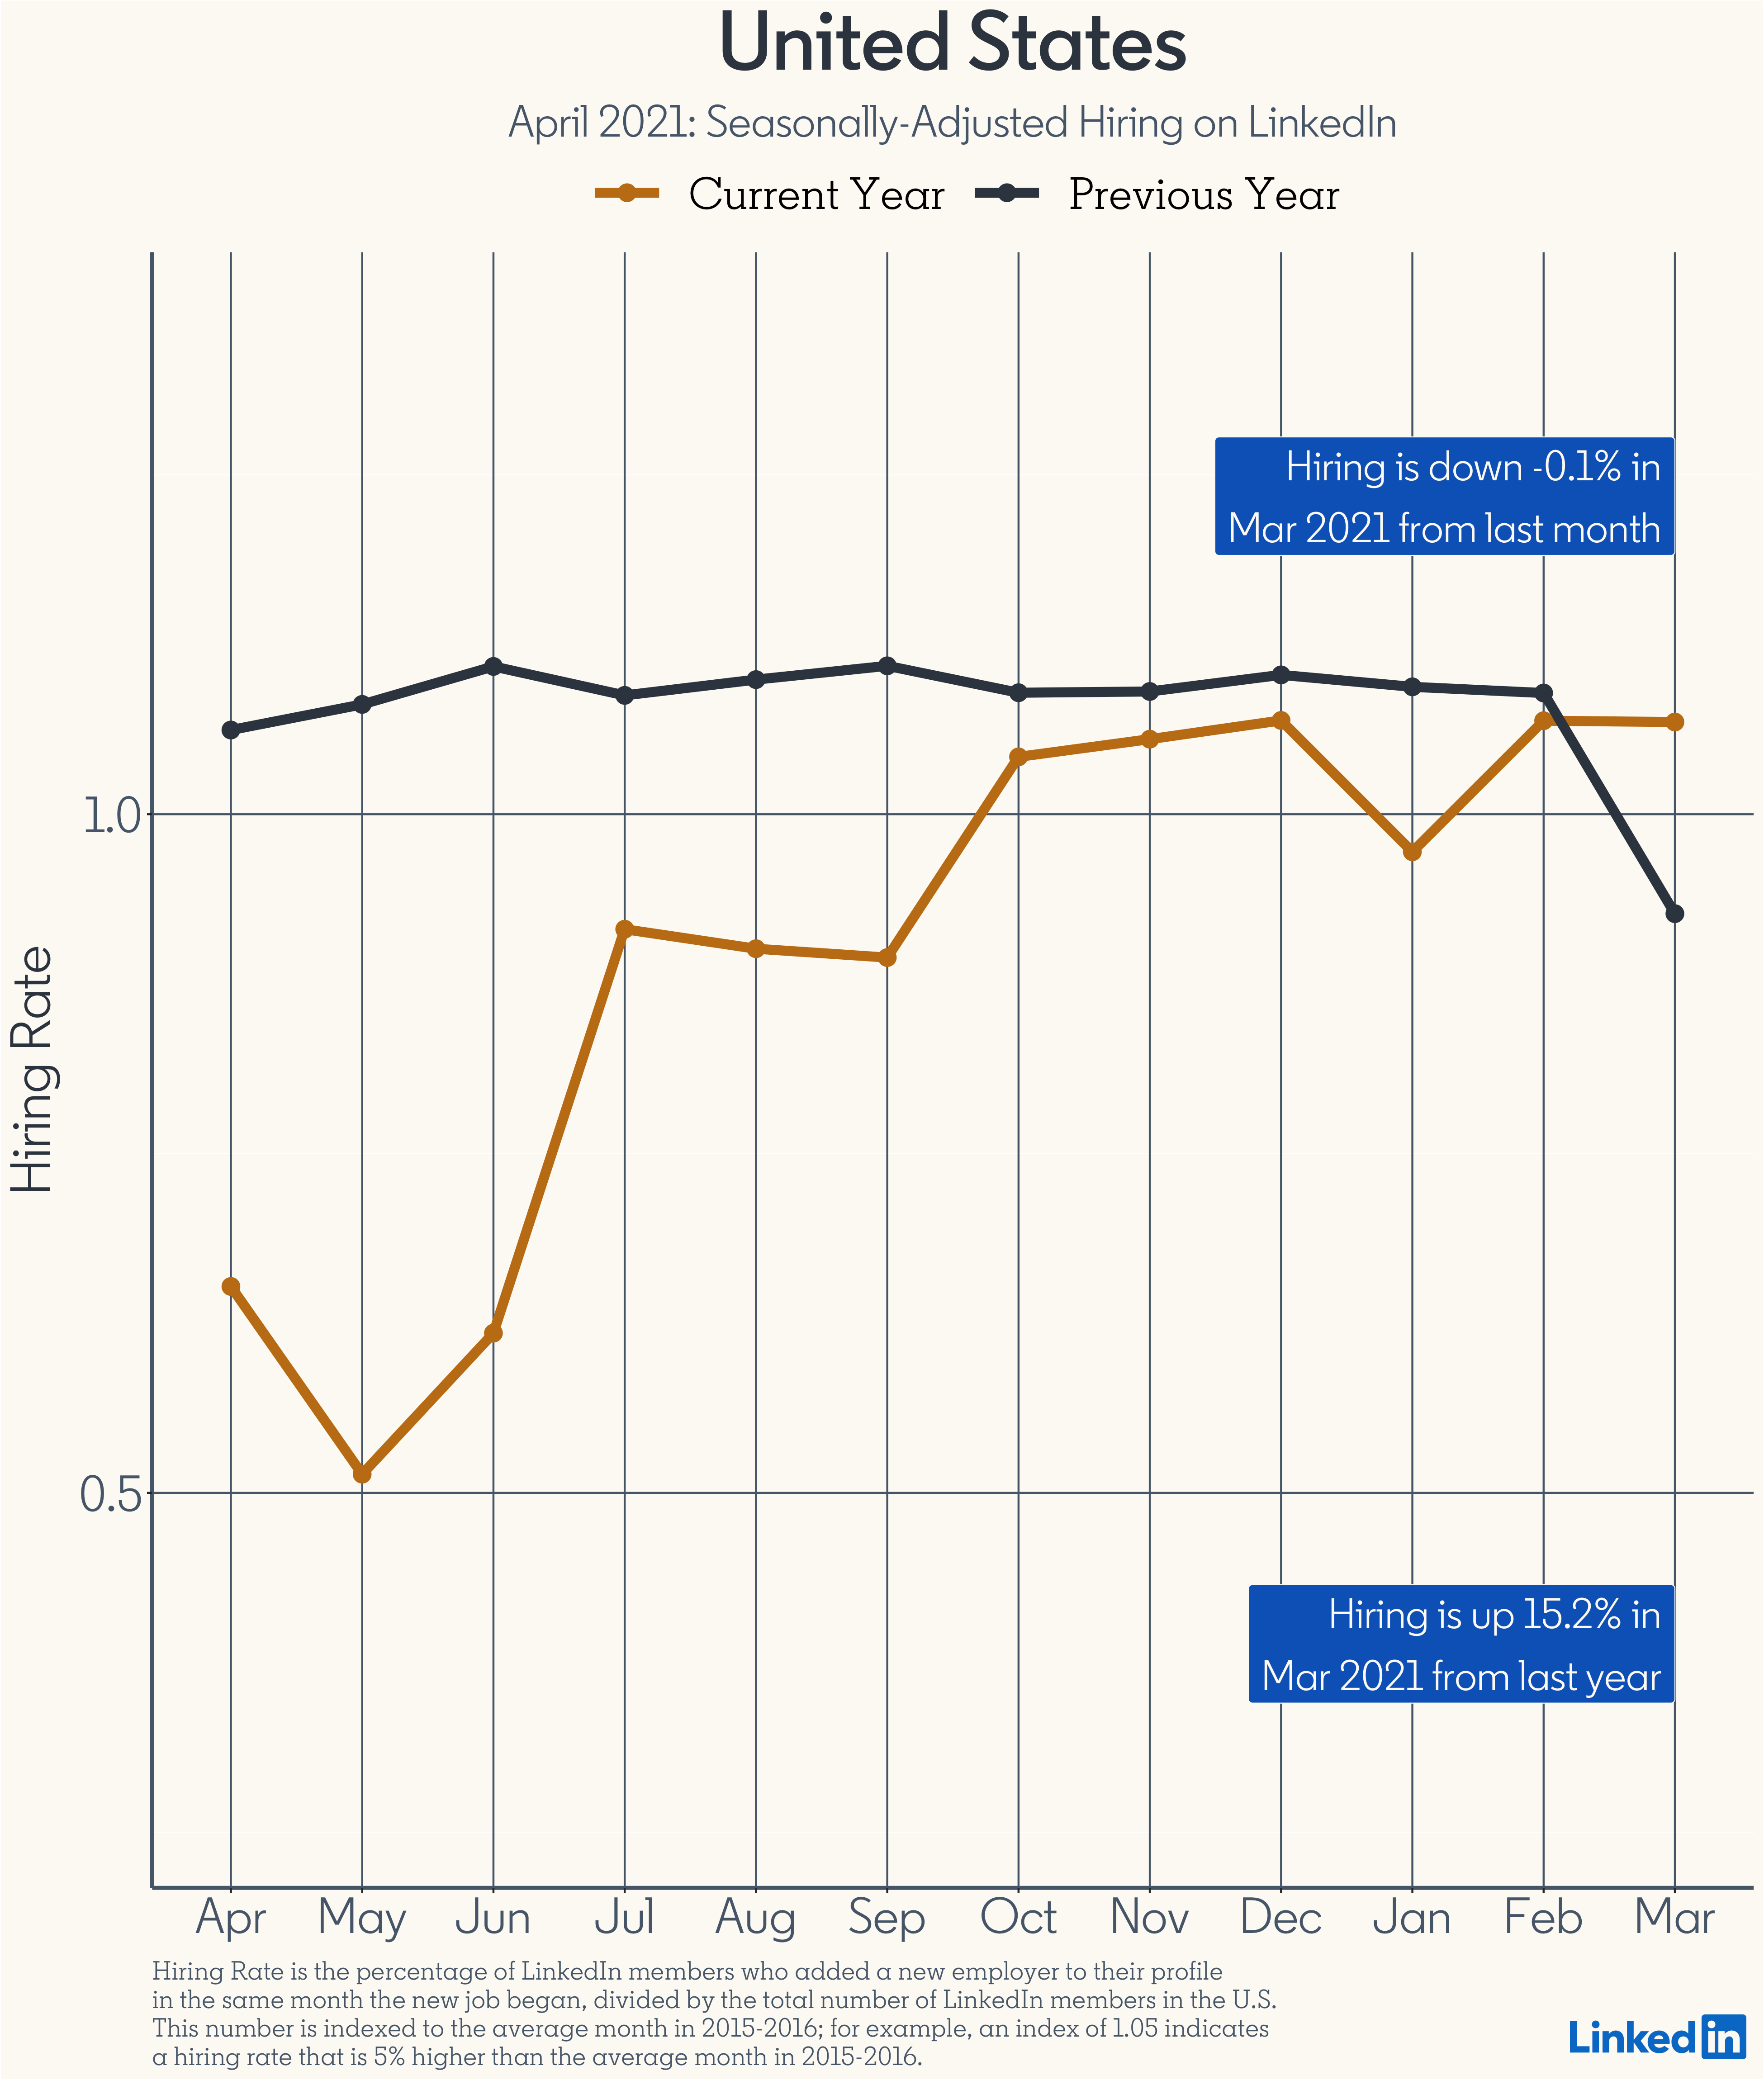
Nationally, across all industries, hiring in the U.S. was 15.2% higher than in March 2020. National hiring was 0.1% lower in March from February 2021. The industries with the most notable hiring shifts month-to-month in March were Recreation & Travel (9.8% higher); Consumer Goods (7.5% higher); and Transportation & Logistics (6.4% higher).
After a big gain in February, US hiring held steady in March near its highest levels since the pandemic began. Hiring is now only 2.0% below its pre-COVID level. Furthermore, we’re beginning to see the recovery broaden. Twelve industries are now hiring at or above their pre-COVID level, versus nine a month ago and five two months ago.
The breadth of the recovery is improving as more cities and industries are regaining their pre-COVID hiring level. Seven metro areas of the 20 we track regularly are now hiring at or above their pre-COVID level, versus two last month and zero two months ago. These cities include Atlanta (3.3%), Austin (6.0%), Boston (0.5%), Denver (1.5%), Miami (1.7%), Nashville (1.3%), Phoenix (1.4%)
Hiring
The LinkedIn hiring rate is a measure of hires divided by LinkedIn membership. Nationally, across all industries, hiring in the U.S. was 15.2% higher than in March 2020. National hiring was 0.1% lower in March from February 2021.
The industries with the most notable hiring shifts month-to-month in March were Recreation & Travel (9.8% higher m/m); Consumer Goods (7.5% higher m/m); and Transportation & Logistics (6.4% higher m/m).
Table 1: Hiring on LinkedIn, by Industry, through March 2021
Industry | Mar-20 | ··· | Dec-20 | Jan-21 | Feb-21 | Mar-21 | MoM% Change | YoY% Change |
Agriculture | 1.16 | ··· | 1.25 | 1.15 | 1.20 | 1.25 | +4.1 | +7.9 |
Arts | 0.42 | ··· | 0.59 | 0.57 | 0.62 | 0.55 | -11.8 | +29.1 |
Construction | 1.07 | ··· | 1.07 | 1.02 | 1.12 | 1.15 | +3.2 | +8.1 |
Consumer Goods | 0.81 | ··· | 0.92 | 0.87 | 0.91 | 0.97 | +7.5 | +19.9 |
Corporate Services | 1.04 | ··· | 1.06 | 1.07 | 1.11 | 1.16 | +4.4 | +11.2 |
Education | 0.80 | ··· | 0.95 | 0.94 | 0.96 | 0.95 | -1 | +18.4 |
Energy & Mining | 0.97 | ··· | 0.87 | 0.81 | 0.86 | 0.91 | +5.9 | -6.1 |
Entertainment | 0.71 | ··· | 0.78 | 0.68 | 0.80 | 0.82 | +3 | +14.9 |
Finance | 1.05 | ··· | 1.07 | 1.11 | 1.15 | 1.18 | +2.9 | +12.8 |
Hardware & Networking | 0.78 | ··· | 0.82 | 0.80 | 0.84 | 0.85 | +2 | +9.5 |
Health Care | 1.00 | ··· | 1.17 | 1.16 | 1.16 | 1.21 | +3.9 | +20.1 |
Legal | 0.88 | ··· | 0.96 | 0.97 | 0.96 | 0.97 | +1.1 | +9.8 |
Manufacturing | 0.96 | ··· | 1.02 | 1.03 | 1.07 | 1.06 | -1.1 | +9.9 |
Nonprofit | 0.86 | ··· | 0.99 | 0.96 | 1.00 | 1.00 | -0.4 | +16.1 |
Public Administration | 1.07 | ··· | 1.14 | 1.03 | 1.09 | 1.10 | +1.1 | +3.3 |
Public Safety | 0.97 | ··· | 1.01 | 0.94 | 0.97 | 0.99 | +2.6 | +2.1 |
Real Estate | 1.11 | ··· | 1.23 | 1.22 | 1.28 | 1.32 | +3.4 | +19.3 |
Recreation & Travel | 0.70 | ··· | 0.80 | 0.58 | 0.80 | 0.88 | +9.8 | +26.2 |
Retail | 0.91 | ··· | 1.00 | 0.96 | 0.97 | 0.98 | +1.4 | +7.2 |
Software & IT Services | 1.12 | ··· | 1.12 | 1.15 | 1.23 | 1.30 | +6.1 | +16.4 |
Transportation & Logistics | 0.96 | ··· | 1.14 | 1.11 | 1.16 | 1.23 | +6.4 | +28.4 |
Wellness & Fitness | 0.94 | ··· | 1.16 | 1.10 | 1.16 | 1.22 | +5.4 | +29.5 |
Methodology: “Hiring Rate” is the count of hires (LinkedIn members in each industry who added a new employer to their profile in the same month the new job began), divided by the total number of LinkedIn members in the U.S. By only analyzing the timeliest data, we can make accurate month-to-month comparisons and account for any potential lags in members updating their profiles. This number is indexed to the average month in 2015-2016 for each industry; for example, an index of 1.05 indicates a hiring rate that is 5% higher than the average month in 2015-2016.
Migration
The U.S. cities losing the most people are Bryan-College Station, TX; State College, PA; and Bloomington, IN. For every 10,000 LinkedIn members in Bryan-College Station, TX, 213 left in the past 12 months.

The U.S. cities gaining the most people are Austin, TX; Nashville, TN; and Tampa-St. Petersburg, FL. For every 10,000 LinkedIn members in Austin, TX, 119 arrived in the last 12 months.

Check out our reports for Atlanta, Austin, Boston, Chicago, Cleveland-Akron, Dallas-Ft. Worth, Denver, Detroit, Houston, Los Angeles, Miami-Ft. Lauderdale, Minneapolis-St. Paul, Nashville, New York City, Philadelphia, Phoenix, San Francisco Bay Area, Seattle, St. Louis, and Washington, D.C., to see which jobs are open.

