Workforce Confidence Index → India
India Workforce Confidence Index (WCI)
The LinkedIn Market Research team surveys its members daily to understand how they’re feeling about their careers, current company, personal finances and more. Every two weeks the team aggregates the survey data to analyze the latest in Workforce Confidence trends. Consumer confidence measures have historically been a key indicator of the economy, and LinkedIn is in a unique position to measure how people feel, to understand what challenges they’re facing and help find them solutions.
In the WCI survey, market researchers ask LinkedIn members about:
1. Their confidence in their ability to get/hold a job, improve their financial situation and progress in their career. We then calculate an ICI (Individual Confidence Index) score from their opinions by assigning each respondent a score (-100, -50, 0, +50, +100), based on how much they agree or disagree with the three statements, and then create a composite average score across all statements.
2. Their confidence in how their employer will fare in the next six months (better or worse than it is currently doing) and calculate a CIE (Confidence in Employer) outlook score from these opinions. The CIE outlook is the percentage of people who said their employer will be "better off" minus the percentage of people who said it will be "worse off" in the next six months.
3. Workforce trends like the desire for flexibility, four-day work weeks, mental health benefits and more.
Select a category below and you will be directed to the corresponding up-to-date data.
Individual confidence in India | Confidence in employers in India
Individual confidence in India
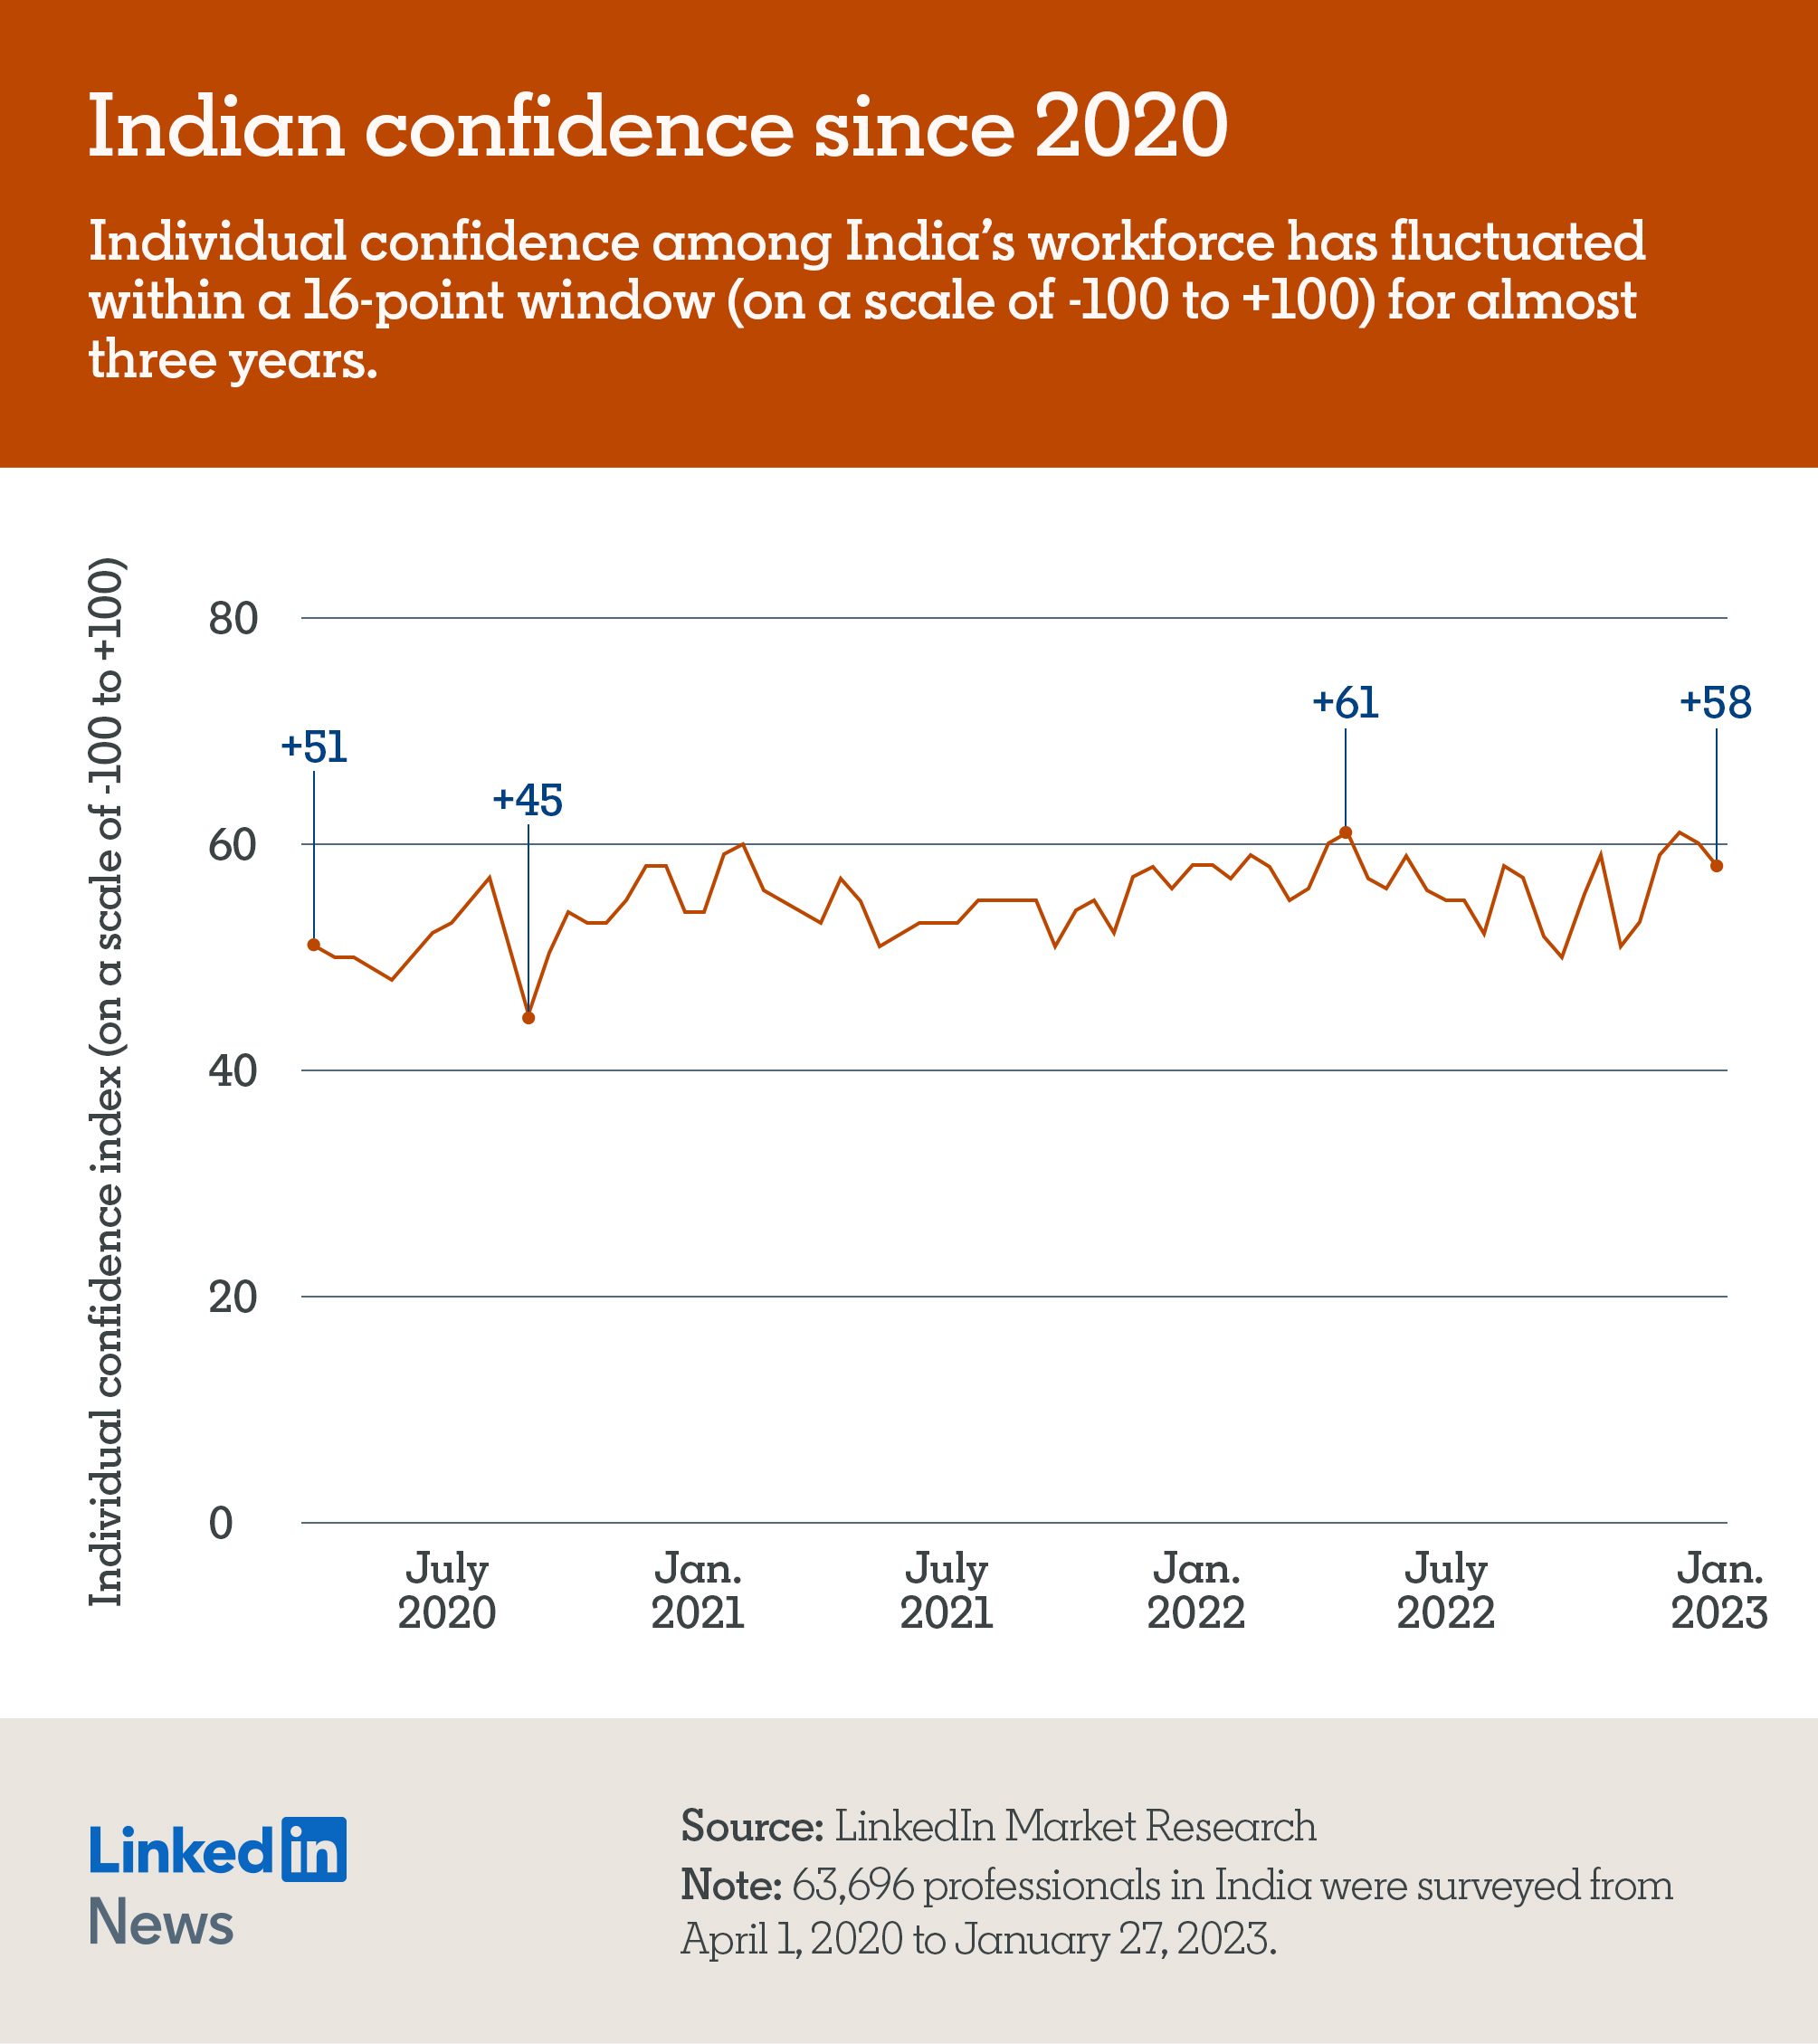
In the WCI survey, LinkedIn market researchers ask LinkedIn members about their confidence in their ability to get/hold a job, improve their financial situation and progress in their career. That is used to calculate an ICI (Individual Confidence Index) score from their opinions by assigning each respondent a score (-100, -50, 0, +50, +100) based on how much they agree or disagree with the three statements, and then create the composite average score across all statements.
Nearly three years after the start of the global COVID-19 pandemic, Indian workforce confidence is slowly improving — despite several dips along the way:
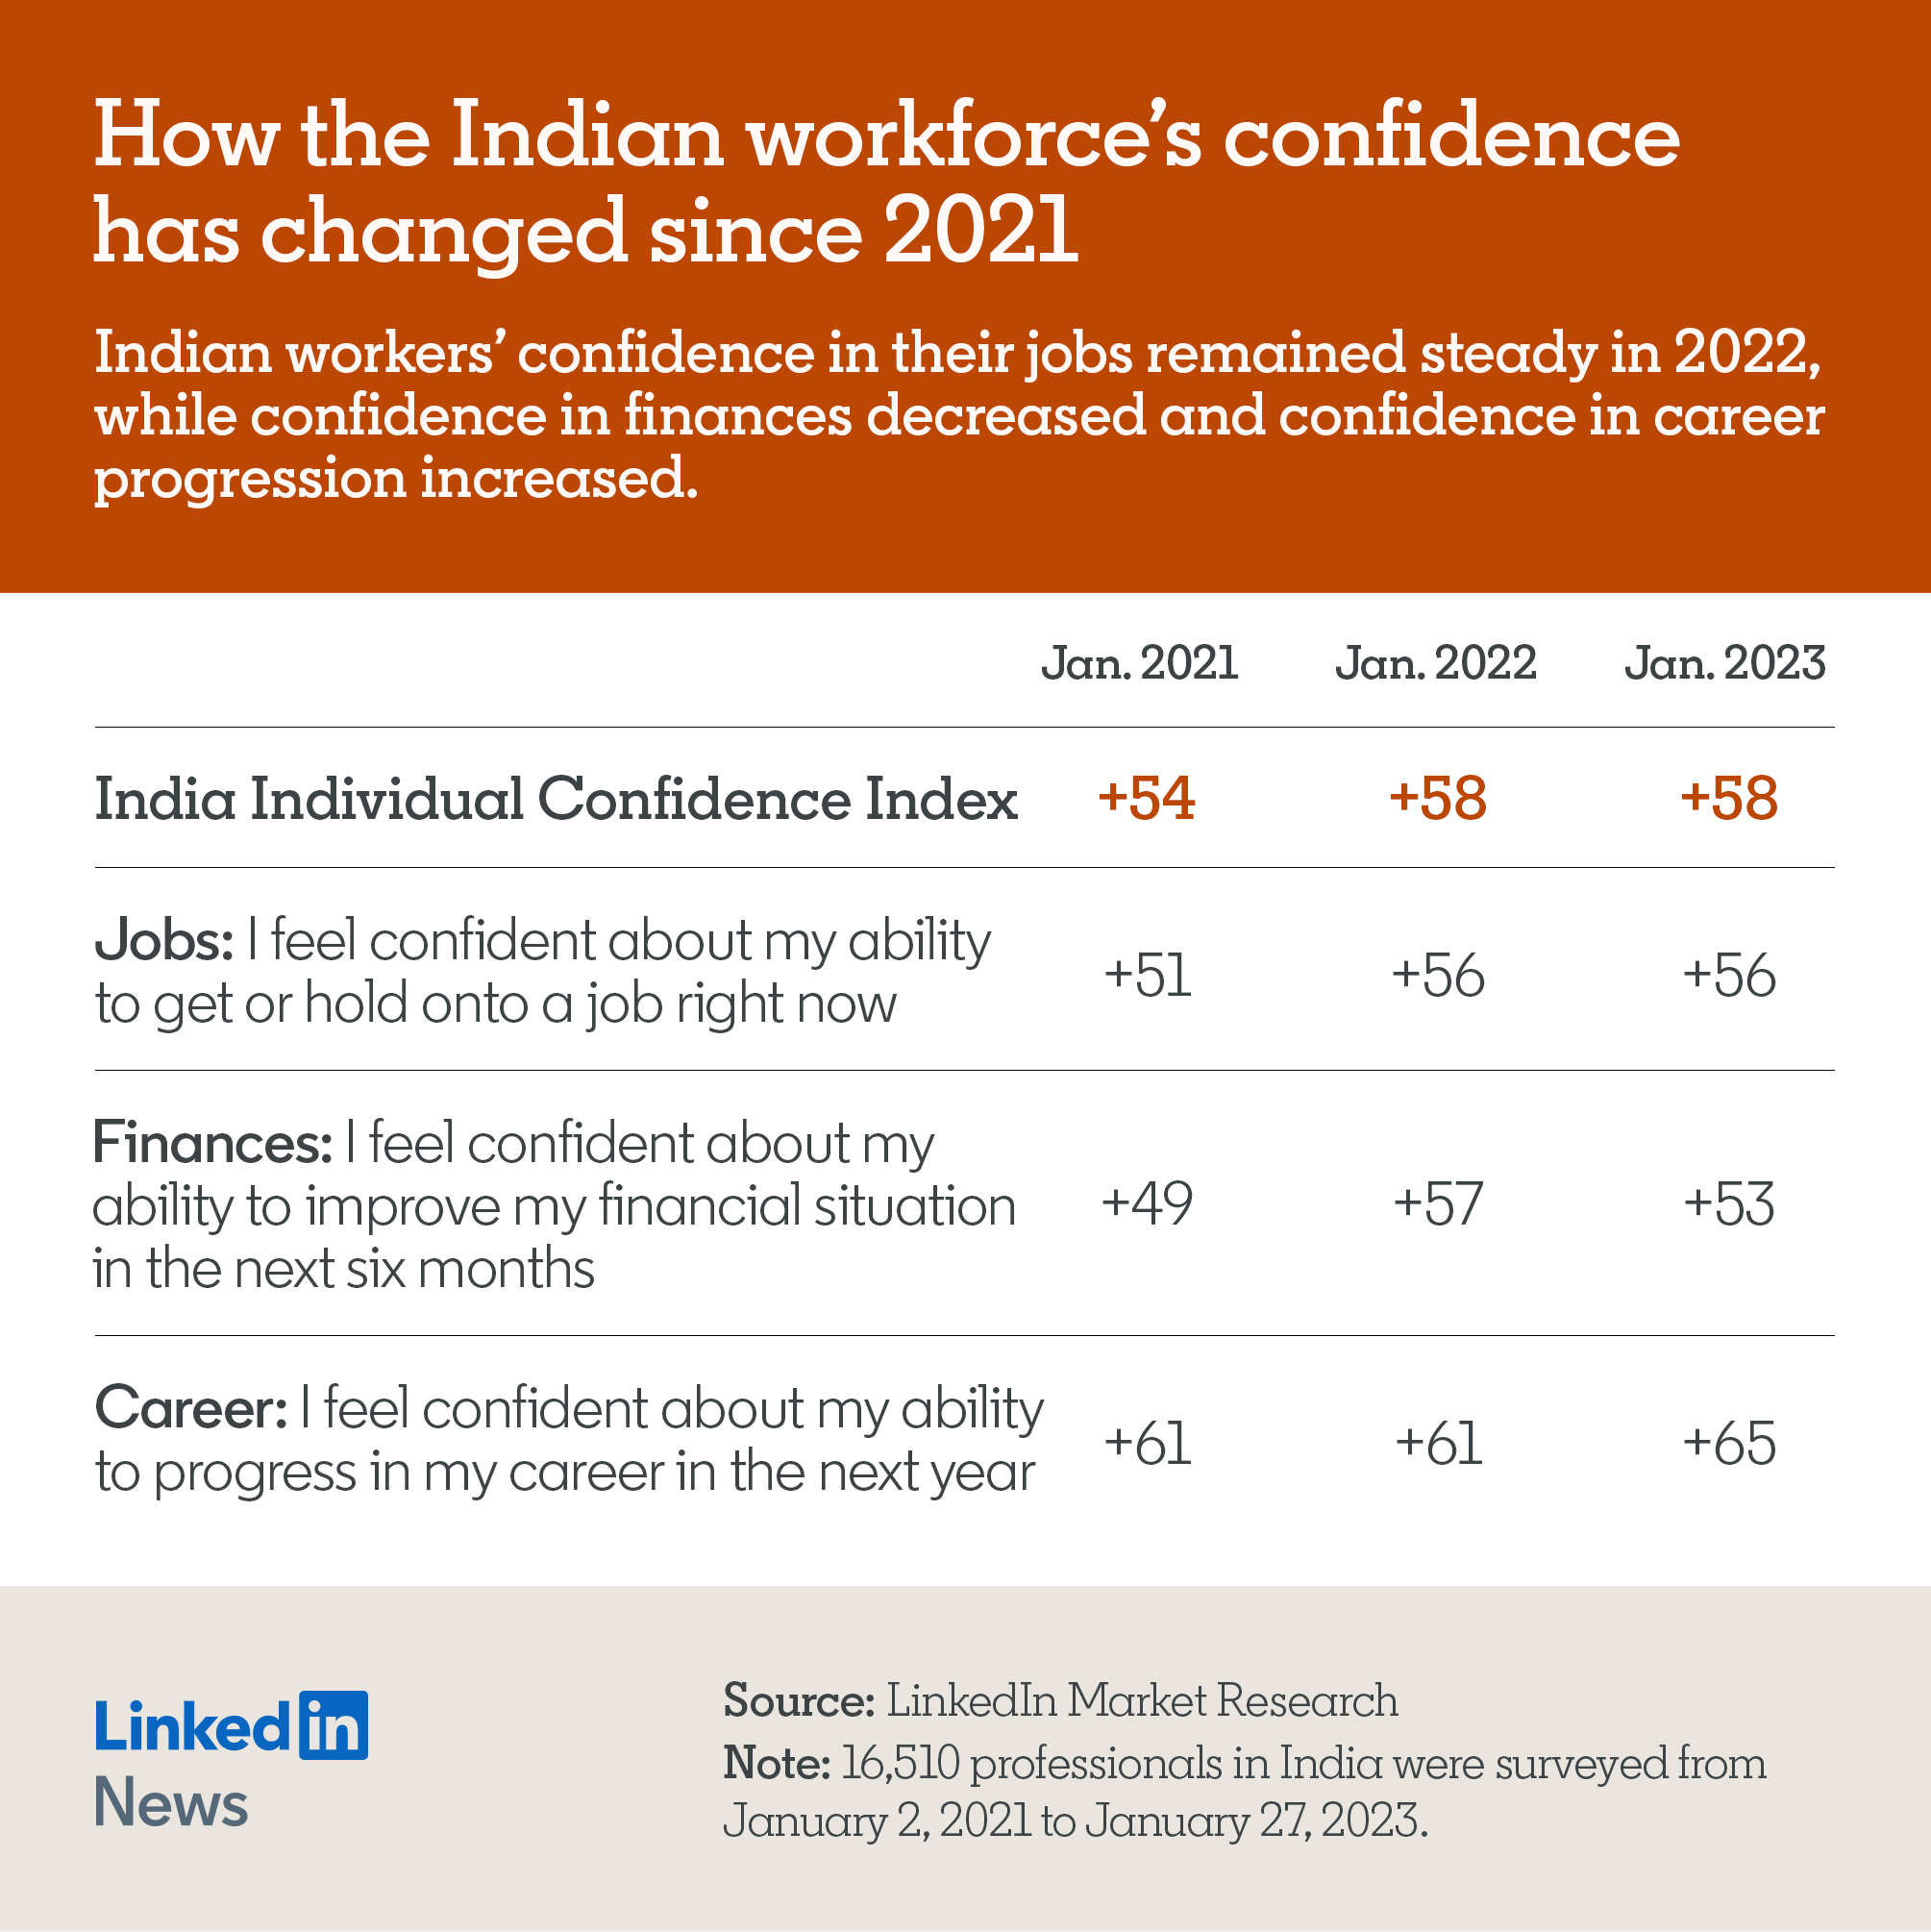
Within the individual confidence index, here is what LinkedIn members in India told us about how confident they’re feeling about their job stability, personal finances and career advancement between January 2021 and January 2023:
Confidence in Employers in India
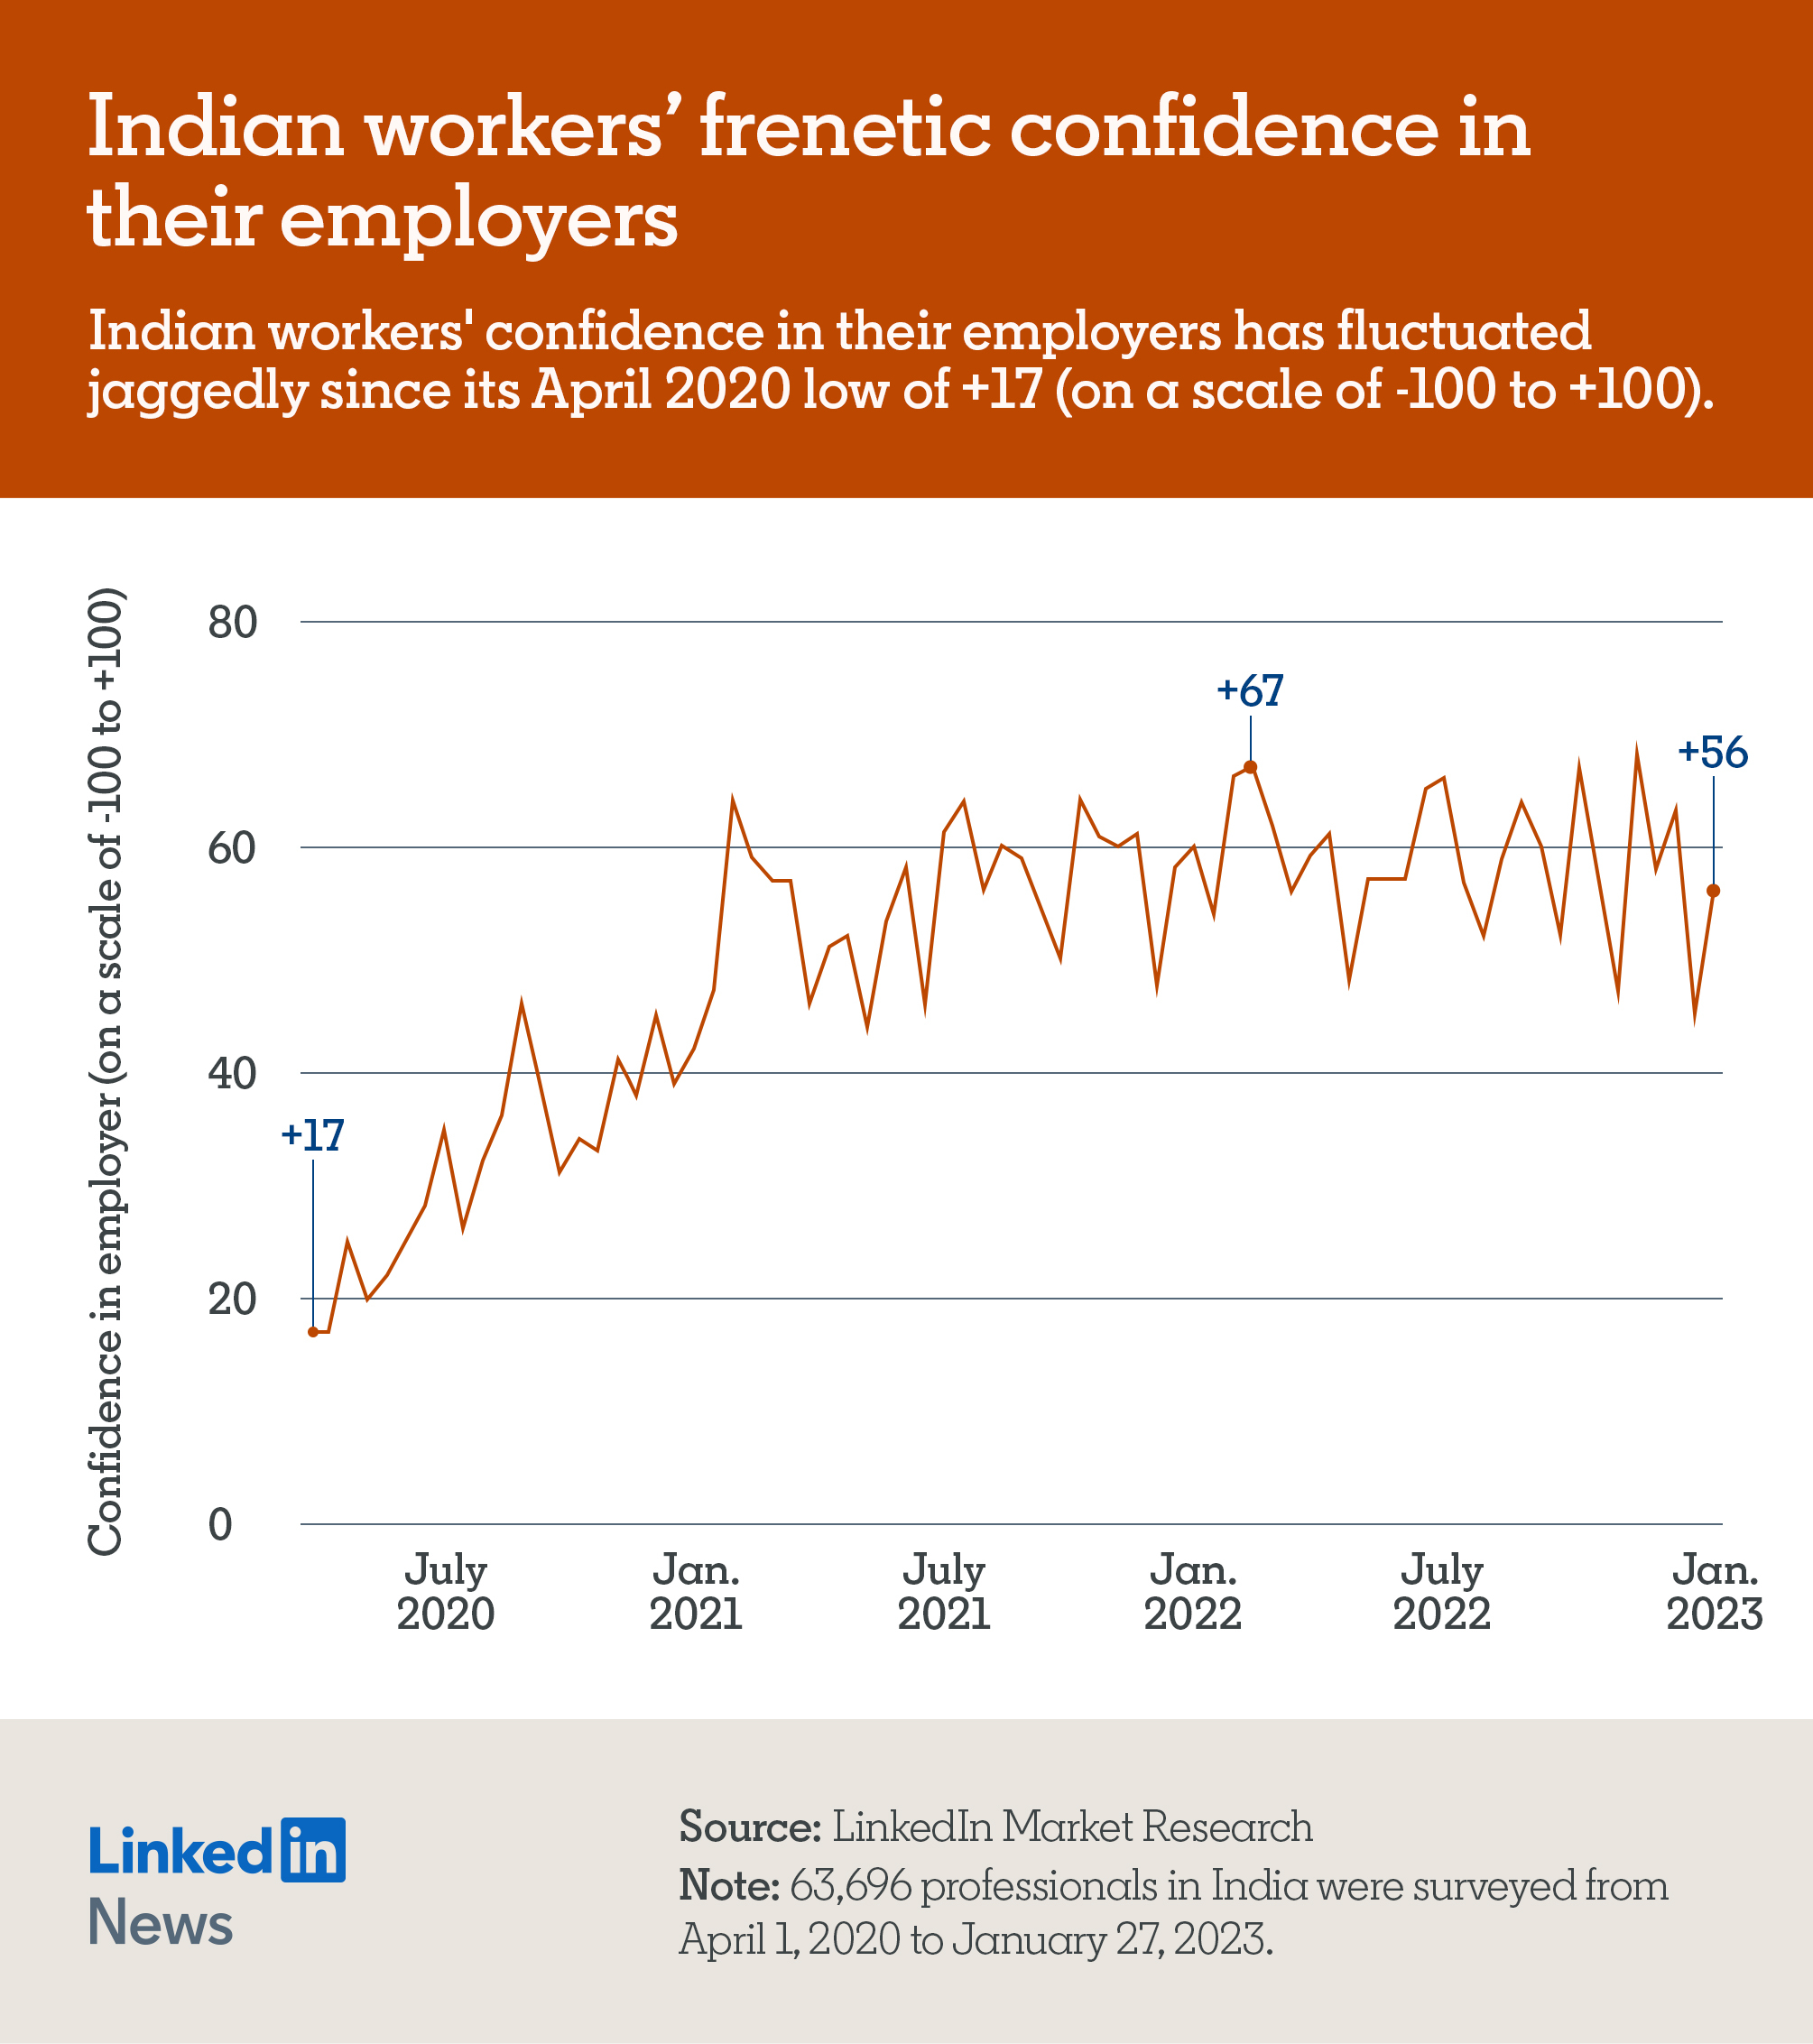
In the WCI survey, LinkedIn market researchers ask LinkedIn members about their confidence in how their employer will fare in the next six months (better or worse) and calculate a CIE (Confidence in Employer) outlook score from these opinions. The CIE outlook is the percentage of people who said their employer will be "better off" minus the percentage of people who said it will be "worse off" in the next six months.
At the start of the pandemic, workers in India had low confidence in their employers (CIE) with a score of +17. While there have been numerous ups and downs over the last ~3 years, including a drop to +47 as well as reaching an all-time high of +68 (both in Nov 2022), CIE has trended up overall. In January 2023, Indian workers had a +56 score for confidence in their employers (CIE).

Methodology
LinkedIn’s Workforce Confidence Index is based on a quantitative online survey from LinkedIn’s Market Research team that is distributed to members via email every day and aggregated every two weeks. Roughly 1,000 Indian-based members respond to each two-week wave of the survey. Members are randomly sampled and must be opted-in to research to participate. Students, stay-at-home partners, and retirees are excluded from analysis to get an accurate representation of those currently active in the workforce. We analyze data in aggregate and will always respect member privacy.
Data is weighted by engagement level to ensure fair representation of various activity levels on the platform. The results represent the world as seen through the lens of LinkedIn’s membership; variances between LinkedIn’s membership and the overall market population are not accounted for.

Follow the Economic Graph team on LinkedIn
Discover our latest content and never miss a report.

Follow the Economic Graph team on LinkedIn
Discover our latest content and never miss a report.