linkedin-logo-full linkedin-logo-icon logo-404-frontlogo-404-back LinkedIn logo LinkedIn logo LinkedIn logo LinkedIn logo LinkedIn logo LinkedIn logo LinkedIn logo LinkedIn logo LinkedIn logo LinkedIn logo LinkedIn logo LinkedIn logo
LinkedIn logo LinkedIn logo LinkedIn Economic Graph
  • Workforce data and research
  • Partnership program
  • Blog
  • In the news
  • About
  • Follow

Workforce Confidence Index → United States

U.S. Workforce Confidence Index (WCI)


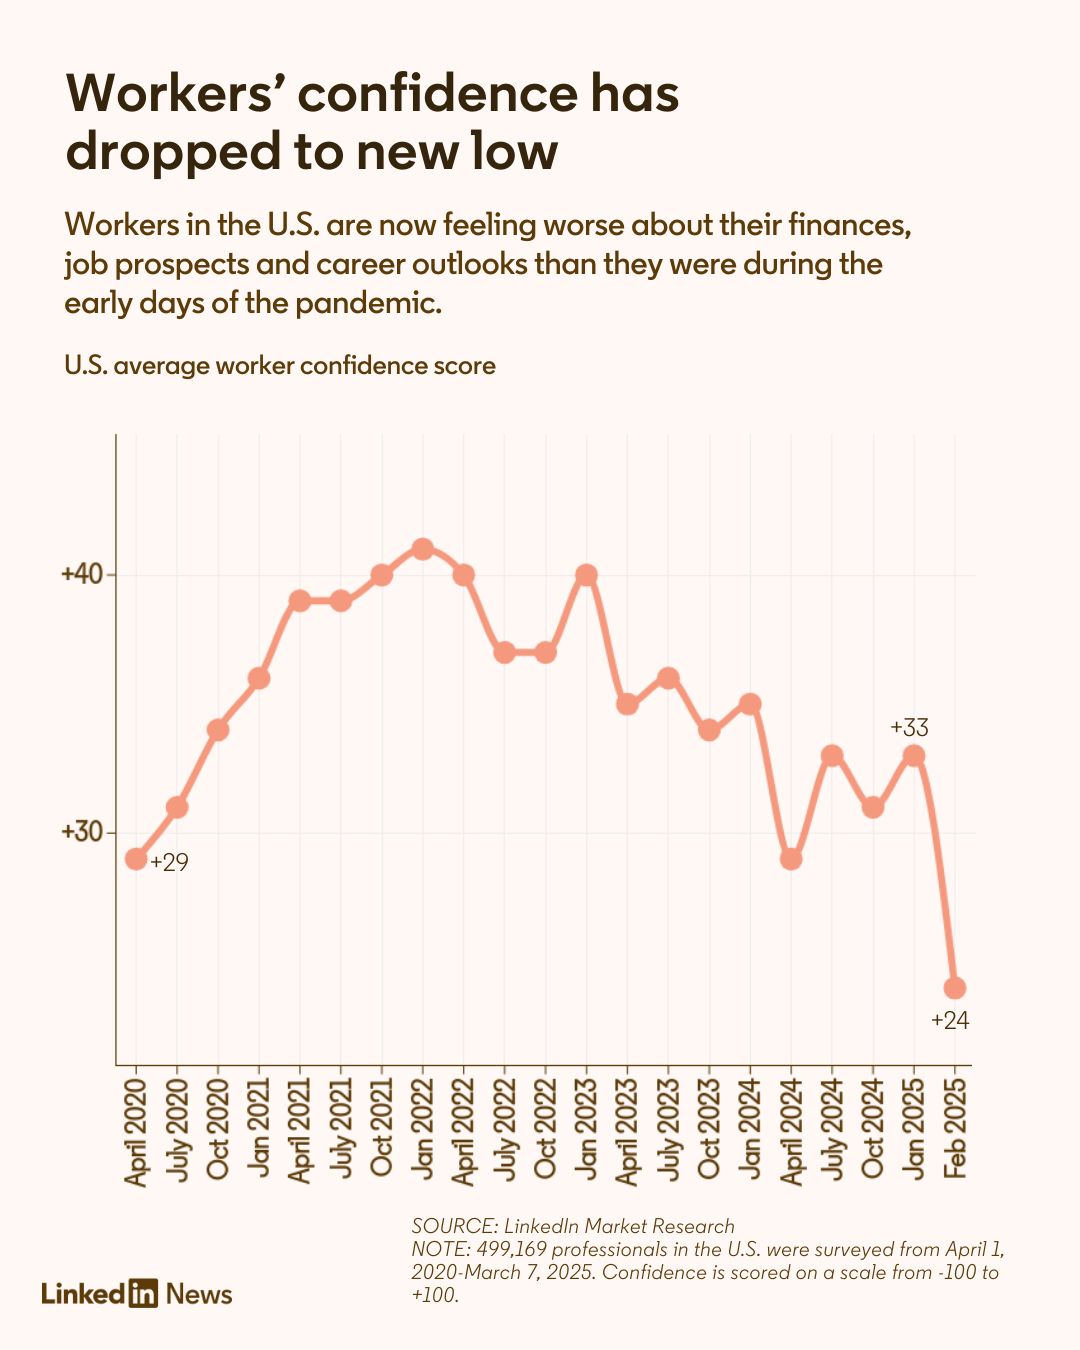
The LinkedIn Market Research team surveys its members daily to understand how they’re feeling about their careers, current company, personal finances, and more. Every two weeks the team aggregates the survey data to analyze the latest in Workforce Confidence trends. Consumer confidence measures have historically been a key indicator of the economy. LinkedIn is in a unique position to measure how people feel, to understand what challenges they’re facing and help find them solutions.

In the WCI survey, we ask LinkedIn members about:

1. Their confidence to get/hold a job, improve their financial situation and progress in their career. We then calculate an ICI (Individual Confidence Index) score from their opinions by assigning each respondent a score (-100, -50, 0, +50, +100), based on how much they agree or disagree with the three statements, and then create the composite average score across all statements.

2. Their confidence in how their employer will fare in the next 6 months (better or worse than it is currently doing) and calculate a CIE (Confidence in Employer) outlook score from these opinions. The CIE outlook is the percentage of people who said their employer will be "better off" minus the percentage of people who said it will be "worse off" in the next six months.

3. Workforce trends like the desire for flexibility, four-day work weeks, mental health benefits and more.

Select a category below and you will be directed to corresponding up-to-date data.


 Individual confidence in the U.S.     |     Confidence in employers in the U.S.  |     Workforce trends in the U.S.    

Individual confidence in the U.S.


In the WCI survey, we ask LinkedIn members about their confidence to get/hold a job, improve their financial situation and progress in their career. We then calculate an ICI (Individual Confidence Index) score from their opinions by assigning each respondent a score (-100, -50, 0, +50, +100), based on how much they agree or disagree with the three statements, and then create the composite average score across all statements.

Two years after the start of the COVID-19 pandemic, individual confidence among U.S. workers was steadily increasing:

Within the individual confidence index, here is what our members in the U.S. told us about how confident they’re feeling about their job stability, personal finances and career advancement between April 2020 and April 2022:

At the start of 2022, we looked into which regions in the U.S. had the highest ICI. In Q1 2022,  2022 quarterly ICI in the U.S. was +41. The Nashville metropolitan area and Greenville-Spartanburg-Anderson area in South Carolina tied for the highest ICI scores in the U.S. during January, February and March of 2022 at +51.

Read about this on LinkedIn News

Confidence in Employers in the U.S.


In the WCI survey, we ask LinkedIn members about their confidence in how their employer will fare in the next six months (better or worse) and calculate a CIE (Confidence in Employer) outlook score from these opinions. The CIE outlook is the percentage of people who said their employer will be "better off" minus the percentage of people who said it will be "worse off" in the next six months.

At the start of the COVID-19 pandemic, U.S. workers had low CIE with a score of +3.  That number improved steadily over the last two years, aside from the dip in the summer of 2020 as companies faced layoffs, and another dip during the 2020 holidays which saw a surge in COVID-19 cases. The CIE metric was at an all-time high of +43 in spring 2021 (coinciding with when vaccines became available in the U.S.). CIE then steadily declined until August 2021. From that point, CIE was relatively stable until recently, when it declined six points from +34 to +28 (with announcements of layoffs and/or hiring freezes by a number of companies in the U.S.). American confidence in employers (CIE) is showing volatility once again.

Read about this on LinkedIn News

Workforce trends in the U.S.


Every quarter, we ask LinkedIn members a series of new survey questions on workforce trends. Over 37,000 American professionals responded to the following survey question between Dec. 4, 2021 and Mar. 11, 2022:

Which of the following statements best describes your attitude towards your current job? In the next six months…

• I plan/hope to stay in my current role
• I plan/hope to take a new role at my current employer
• I plan/hope to leave my job at my current employer
• I do not have specific plans/hopes about my current job

Kicking off 2022, less than half of employed Americans (45%) planned to stay in their current role in the next six months; 17% sought internal mobility and another 17% planned to leave their company. Those in the retail industry appear the most restless with only one in three planning/hoping to stay in their current role, while over half of those in the real estate industry say they plan to stay in their current role.

Read about this on LinkedIn News

Back to top

Methodology

LinkedIn’s Workforce Confidence Index is based on a quantitative online survey from LinkedIn’s Market Research team that is distributed to members via email every day and aggregated every two weeks. Roughly 5,000 U.S.-based members respond to each two-week wave of the survey. Members are randomly sampled and must be opted-in to research to participate. Students, stay-at-home partners, and retirees are excluded from analysis so that we’re able to get an accurate representation of those currently active in the workforce. We analyze data in aggregate and will always respect member privacy.

Data is weighted by engagement level to ensure fair representation of various activity levels on the platform. The results represent the world as seen through the lens of LinkedIn’s membership; variances between LinkedIn’s membership and the overall market population are not accounted for.

Follow the Economic Graph team on LinkedIn


Discover our latest content and never miss a report.

Visit and follow

Follow the Economic Graph team on LinkedIn

Discover our latest content and never miss a report.

Visit and follow
  • About
  • Cookie Policy
  • Privacy Policy
  • Your California Privacy Choices
  • User Agreement
  • Accessibility
LinkedIn logo © LinkedIn Corporation 2023